Insight · Health & Social Care
Inside the Postcode Lottery: What Our Social Care Funding Analysis Found

Managing Director, Bridgehead Communications
Published 6 min read
Our new analysis for the Care Association Alliance shows that age, deprivation and cost explain less than half the gap in what neighbouring councils spend on social care per adult. Here is what the rest of the data behind our funding reform paper actually shows.

Key findings
- Age, deprivation, cost and working-age care need together explain less than half the gap in what neighbouring councils spend on social care per adult; between 55% and 66% of the difference between similar authorities is unexplained by need or cost at all.
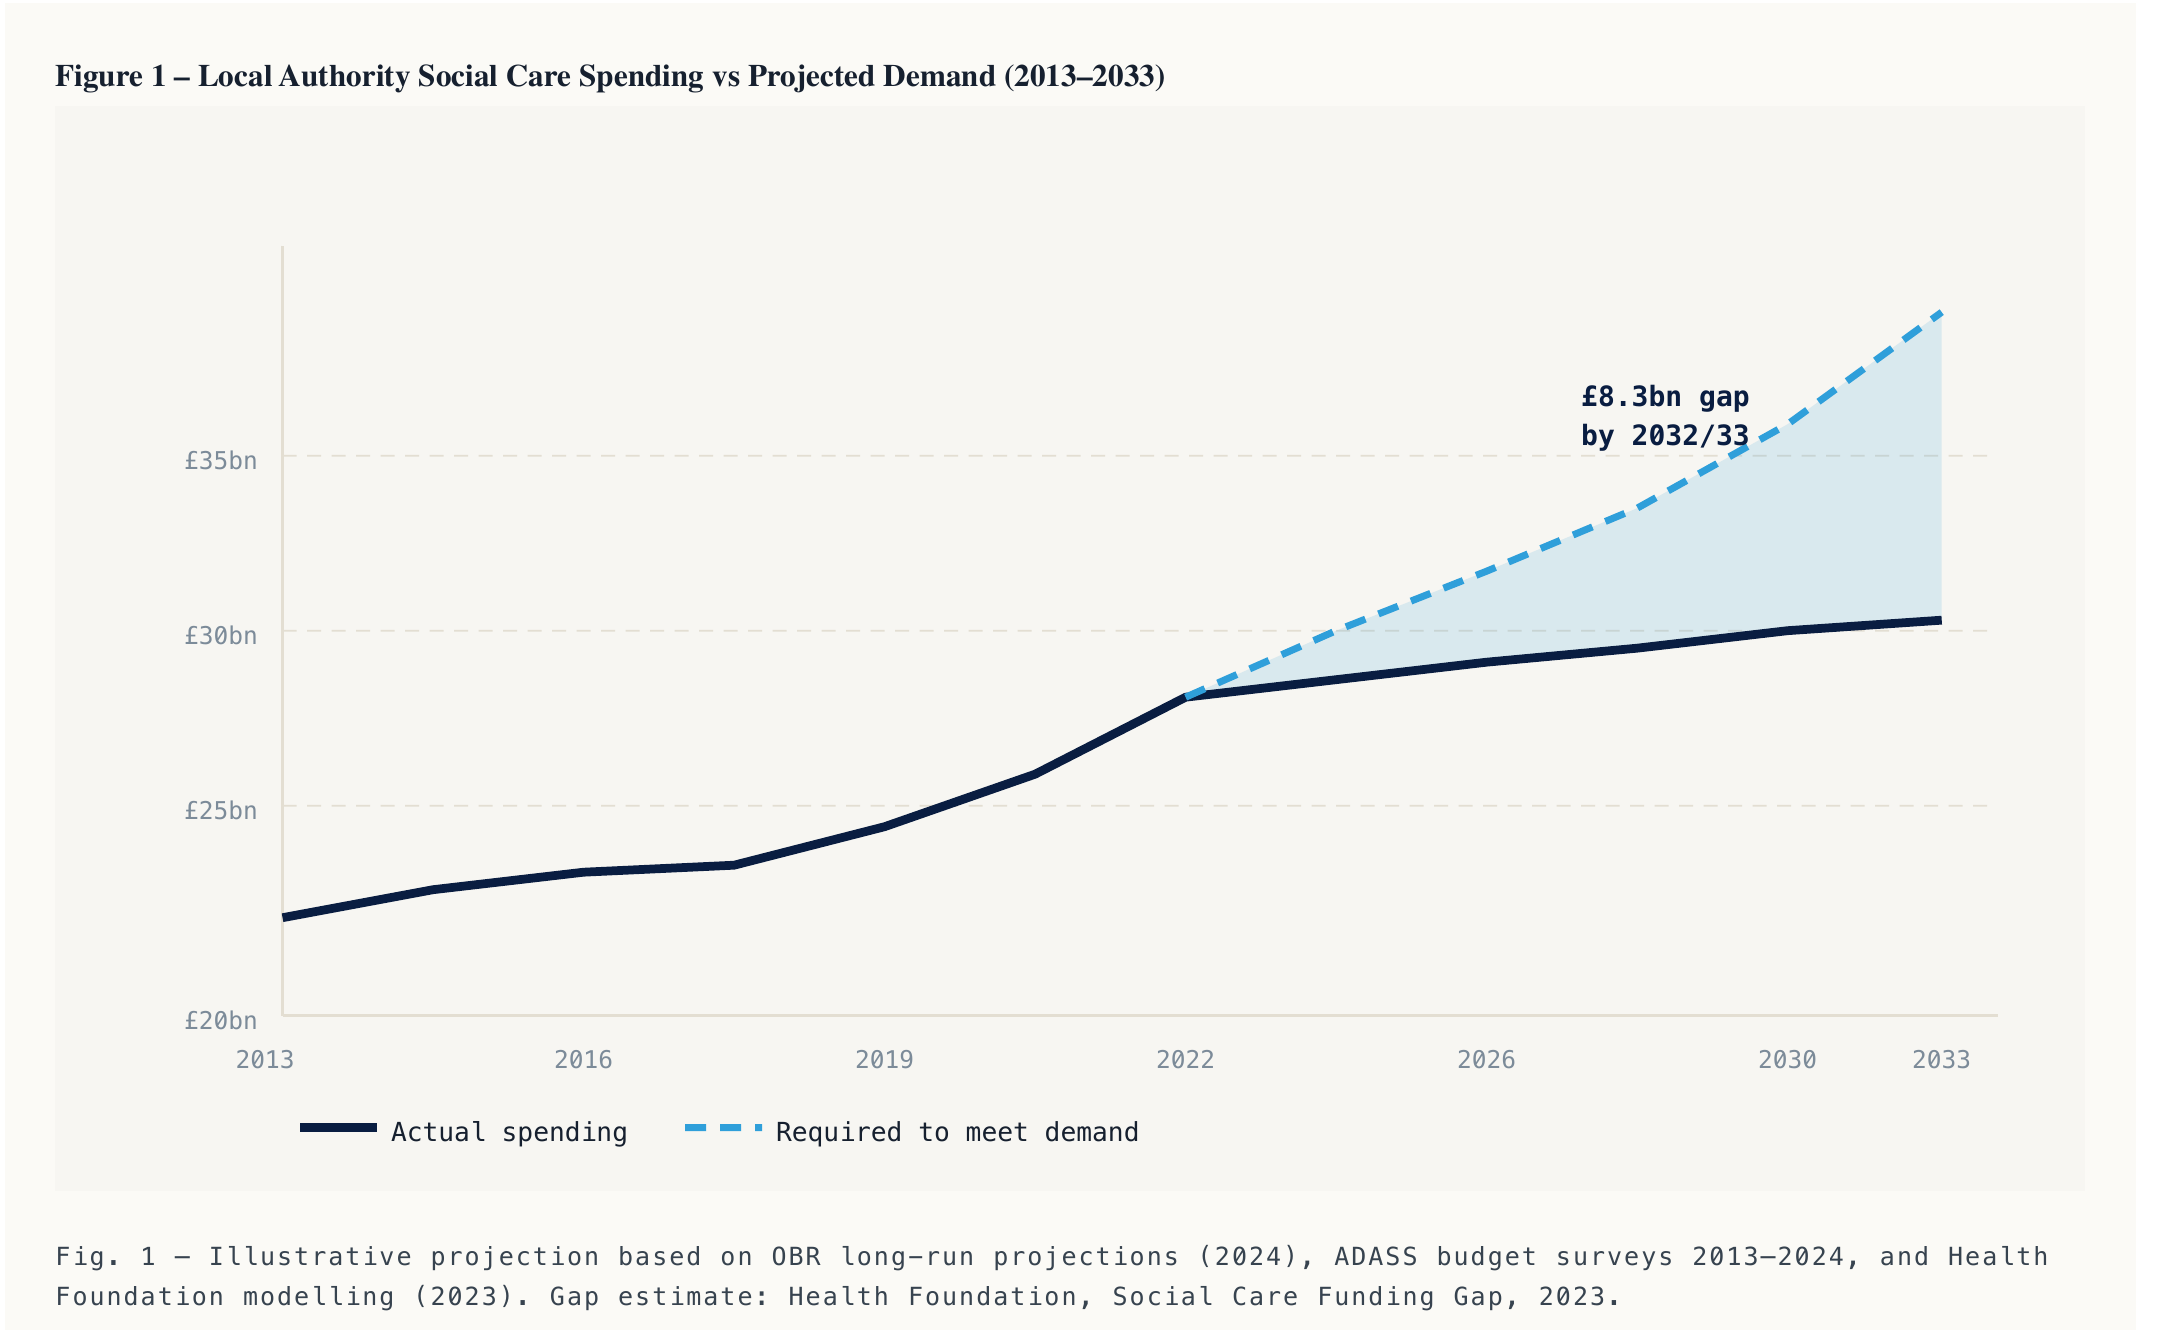
- The OBR projects 3.1% real-terms annual growth is needed to maintain today's system; local authorities have delivered 0.7% a year on average since 2009/10, a shortfall reaching £8.3 billion annually by 2032/33.
- Age-adjusted spend per adult on social care ranges from £392 in Warrington to £991 in the Isles of Scilly (England average £636), and the spread within a single region can exceed the gap between regions.
- Self-funders are charged on average 41% more than publicly funded residents for equivalent care, a cross-subsidy worth over £1 billion a year; unpaid carers provide support the Health Foundation values at £184 billion a year.
I spent the past few months as lead author on Adult Social Care Funding Reform, the first paper in a new research programme the Care Association Alliance is publishing on behalf of the 10,000-plus independent providers its member associations represent. It sits alongside Melanie Weatherley MBE, Damian Green and Tom Zundel's contributions, and it exists to answer one question the Casey Commission cannot avoid: why does the amount of care an older person receives in England still depend so heavily on which side of a council boundary they happen to live on?
The paper is dense with data because the case for reform has to be. Here is what some of the charts behind it actually show.
The gap is structural, and it is getting wider
The Office for Budget Responsibility projects that simply maintaining today's system requires real-terms growth in public social care spending of 3.1 per cent a year. Local authorities have delivered 0.7 per cent a year on average since 2009/10. Plotted against each other, those two lines diverge every year: by 2032/33 the shortfall reaches £8.3 billion annually, and that is the cost of standing still, not the cost of improving anything.
That shortfall is already showing up in who gets help. According to the King's Fund's Social Care 360, the proportion of over-65s receiving publicly funded long-term care has fallen from 6.0 per cent in 2015/16 to 5.2 per cent in 2024/25, even as the number of care requests has climbed past two million a year. Eligibility has not been tightened by any explicit policy decision; it has tightened because 153 individual council budgets have not kept pace with demand, and rationing is what happens next.
A postcode lottery, mapped authority by authority
Age-adjusted spend per adult on social care runs from £392 in Warrington to £960 in Knowsley — both North West councils, so this is not a simple north-south or rich-poor divide. The England average is £636.
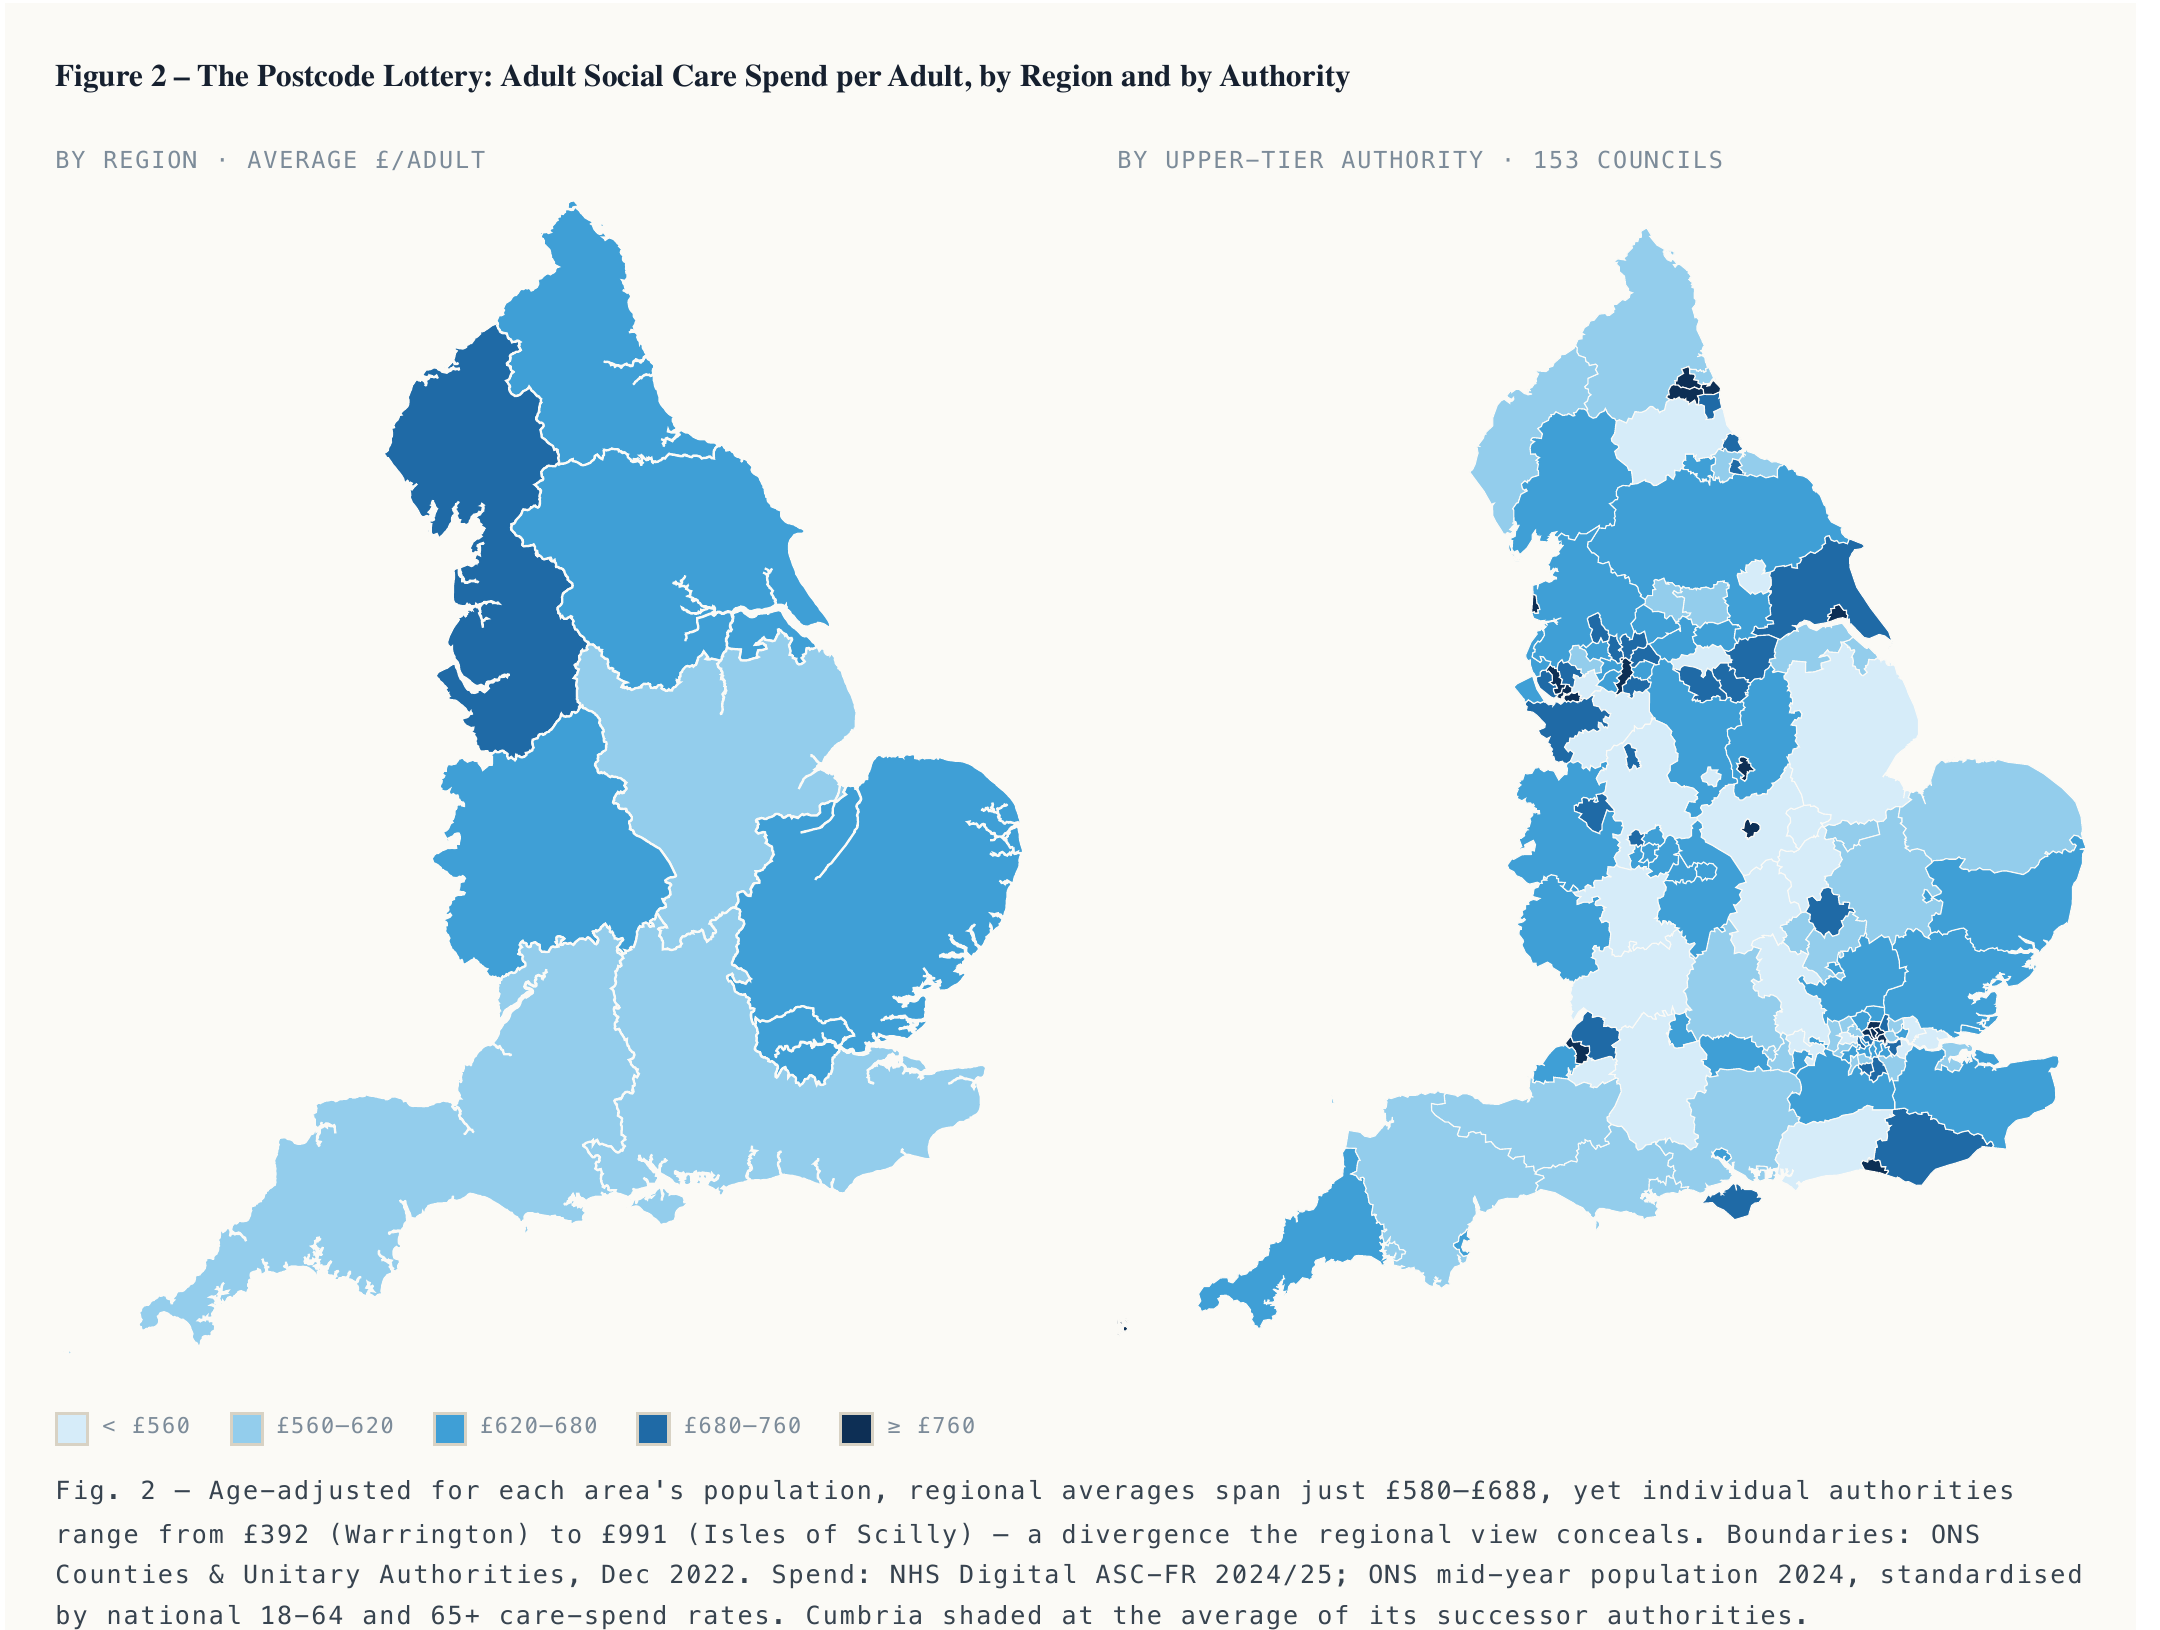
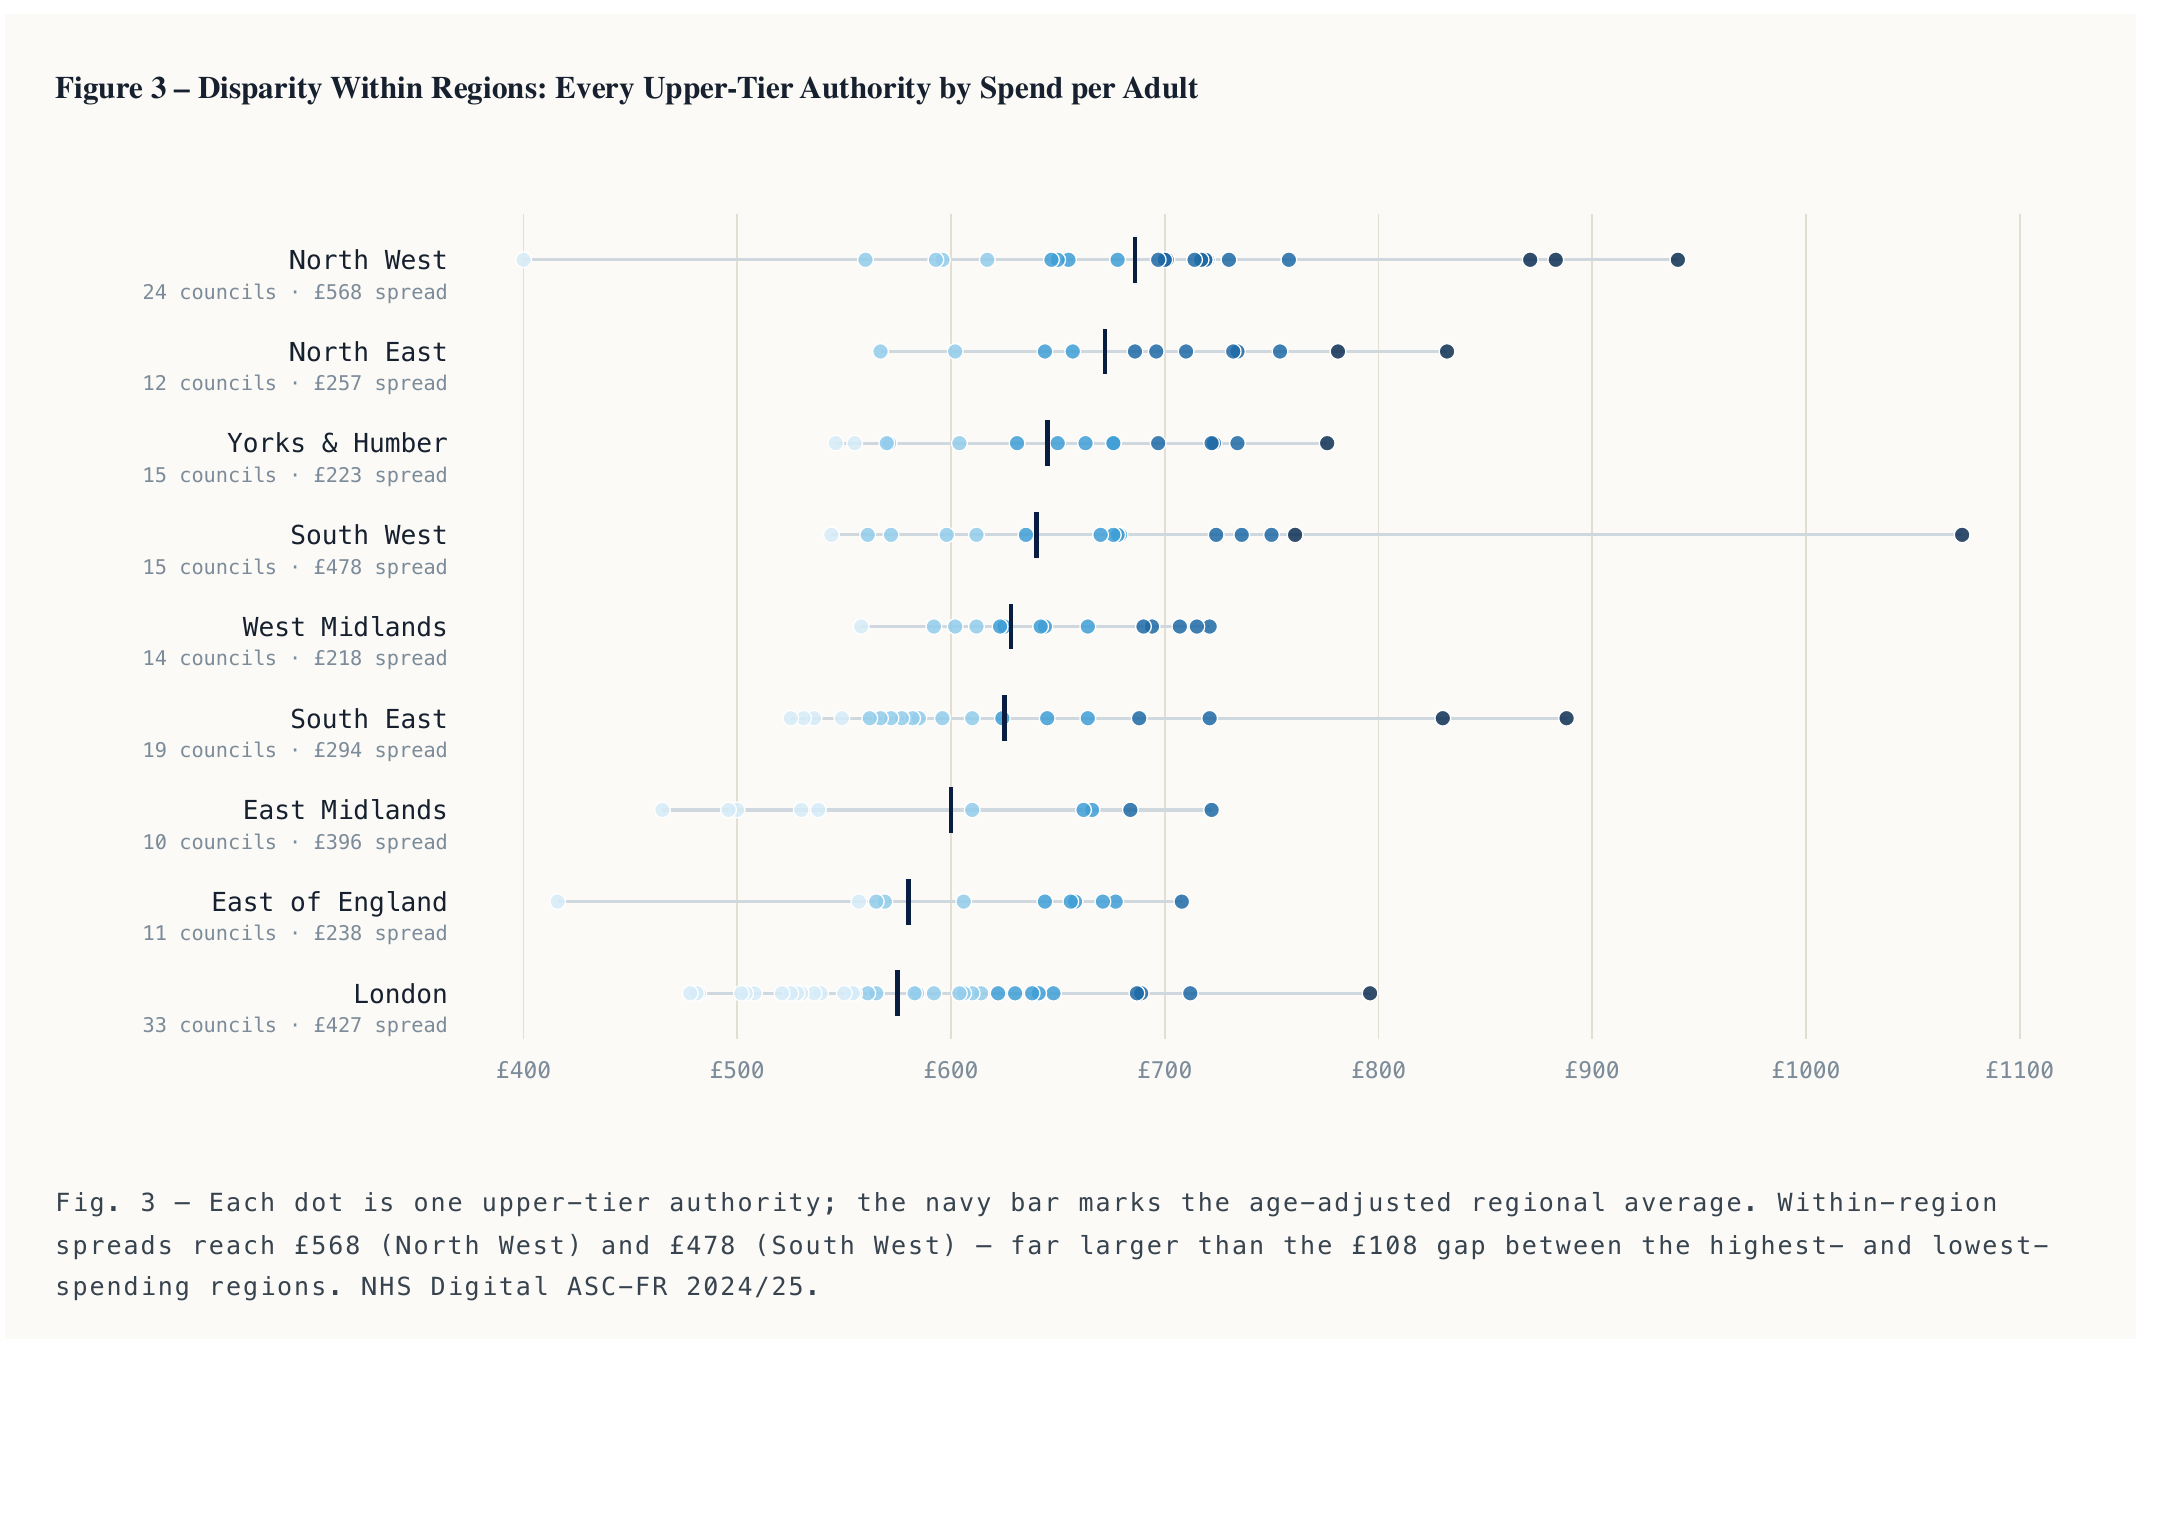
Map every one of the 153 upper-tier authorities and the variation within a single region is often wider than the gap between regions: the North West alone spans a £568 range, more than the entire £109 difference between the highest- and lowest-spending regions of the country.
We then went a step further and asked how much of that variation is actually justified. We modelled every authority's spend against its age profile, local deprivation, the cost of delivering care locally and the level of working-age care need — the legitimate reasons spending should differ. Together, those factors explain less than half of the gap between councils. Between 55 and 66 per cent of the difference in what otherwise similar authorities spend per adult is unexplained by need or cost at all. Age on its own accounts for just 13 per cent.
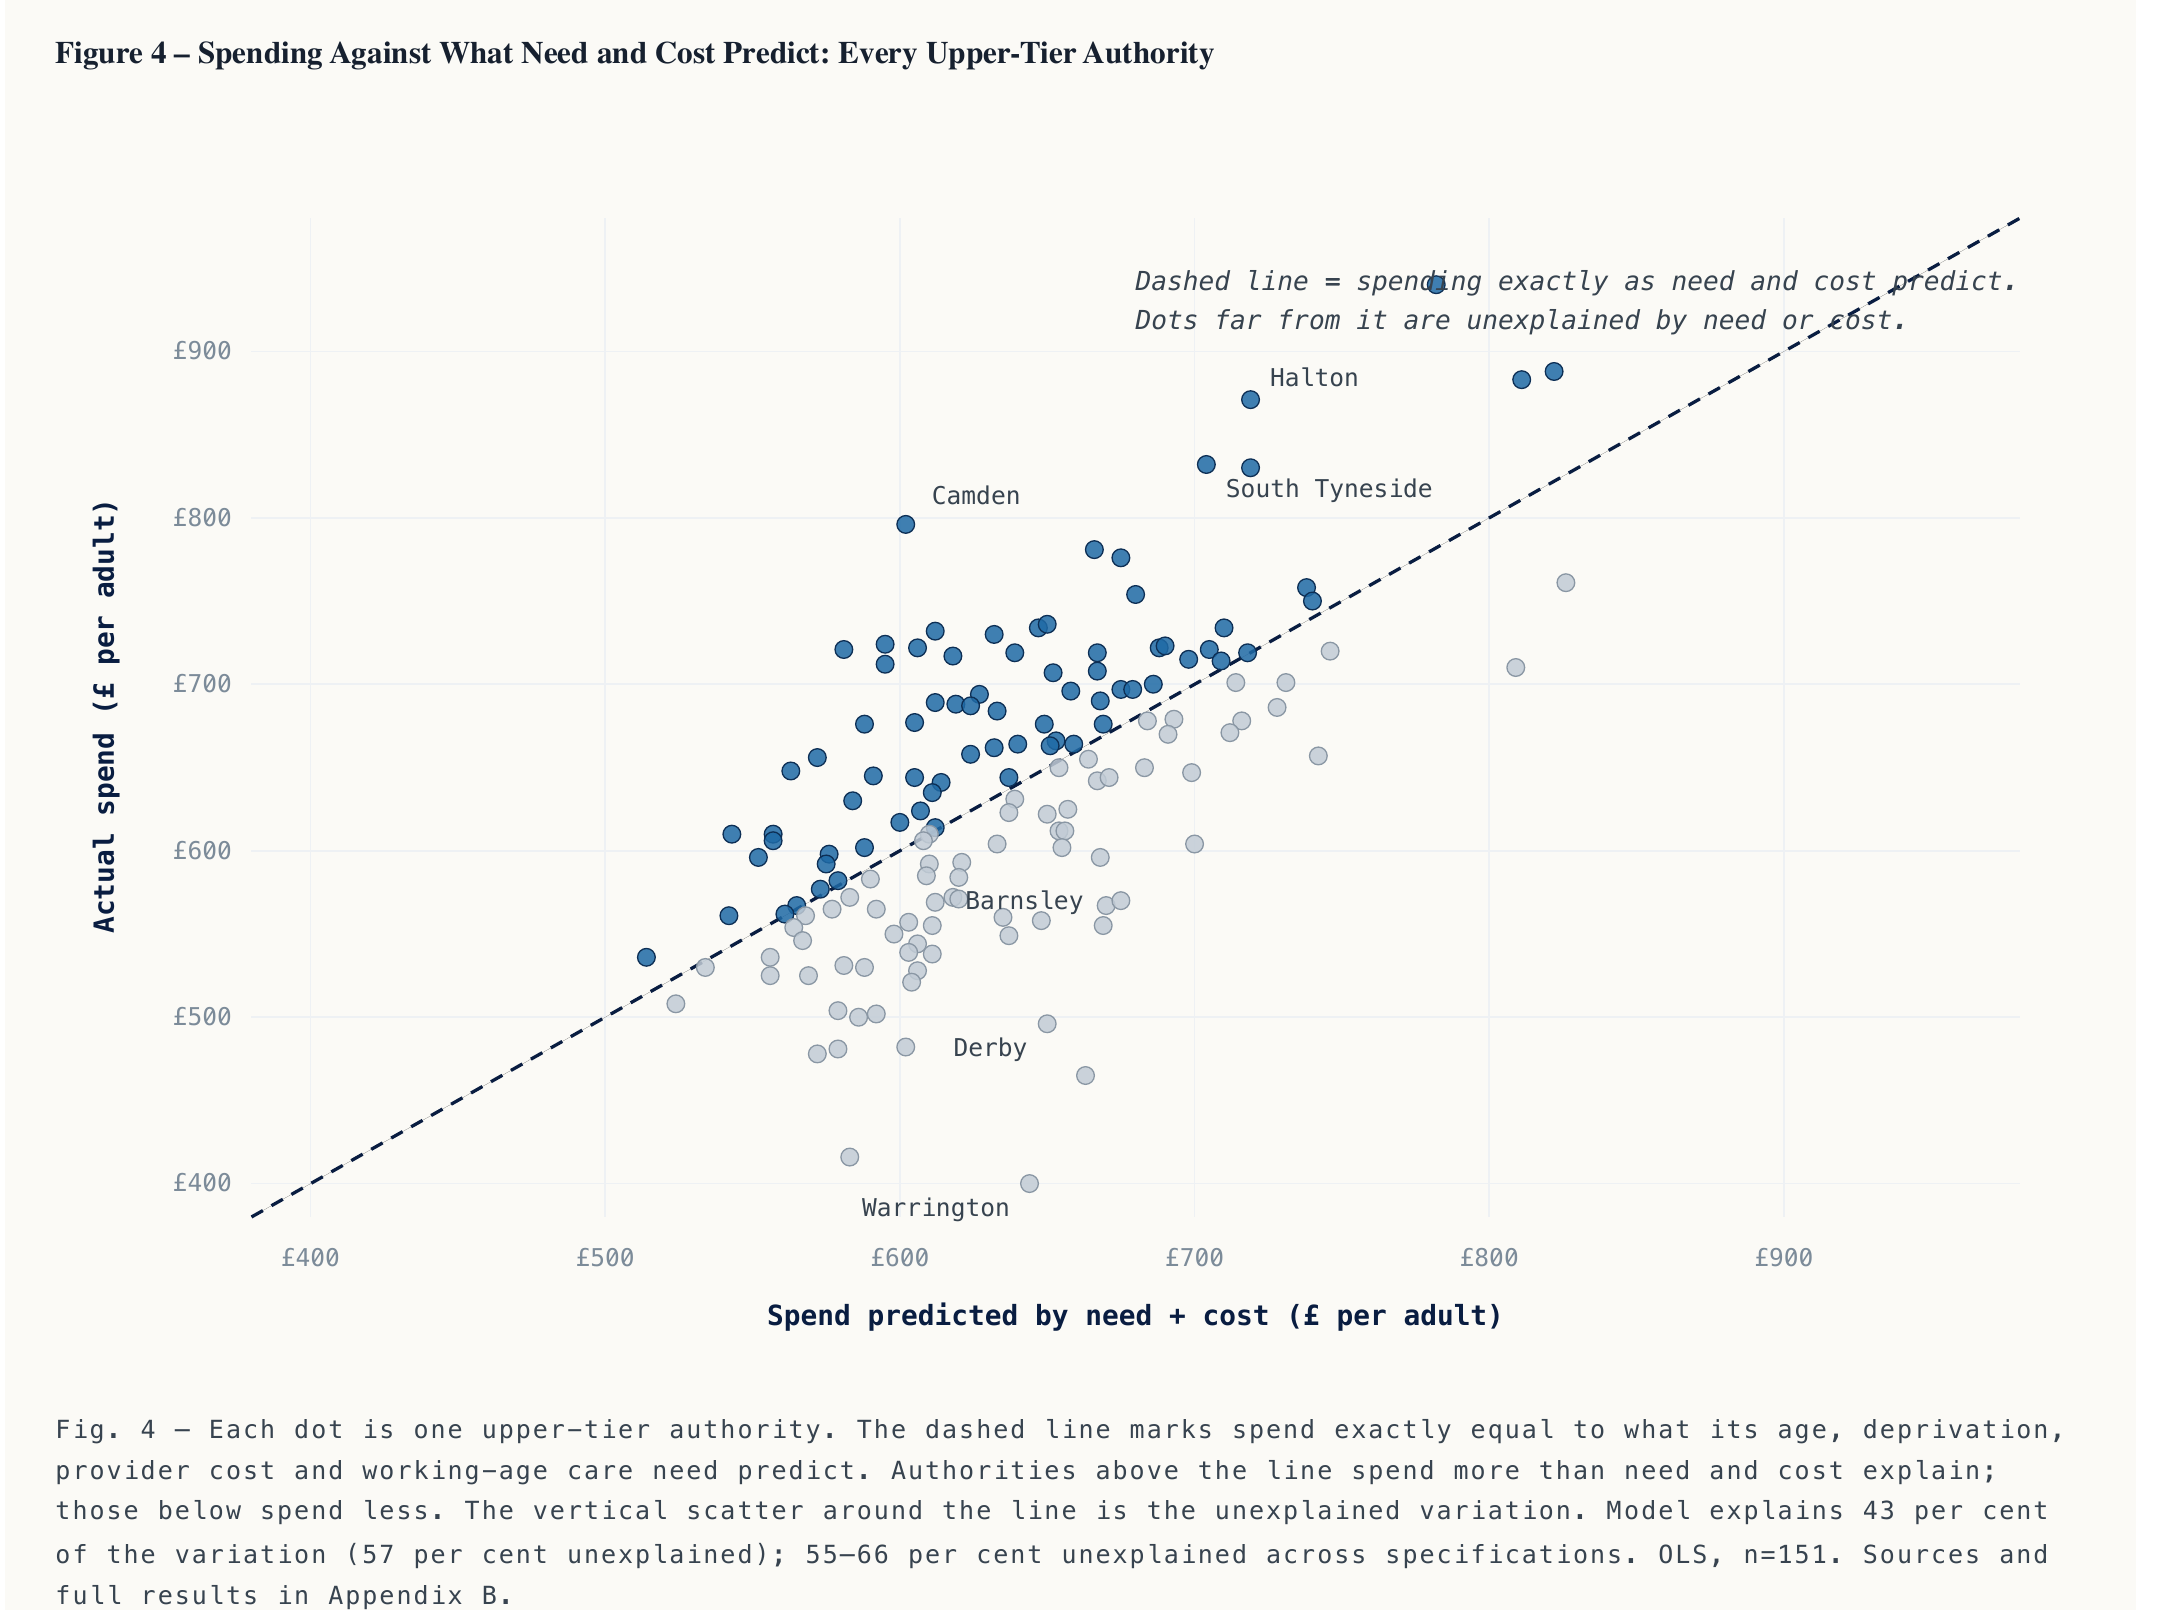
Two councils can have almost identical populations and still spend hundreds of pounds apart per adult, for reasons that have nothing to do with who lives there.
What the frozen system costs a family, and a provider
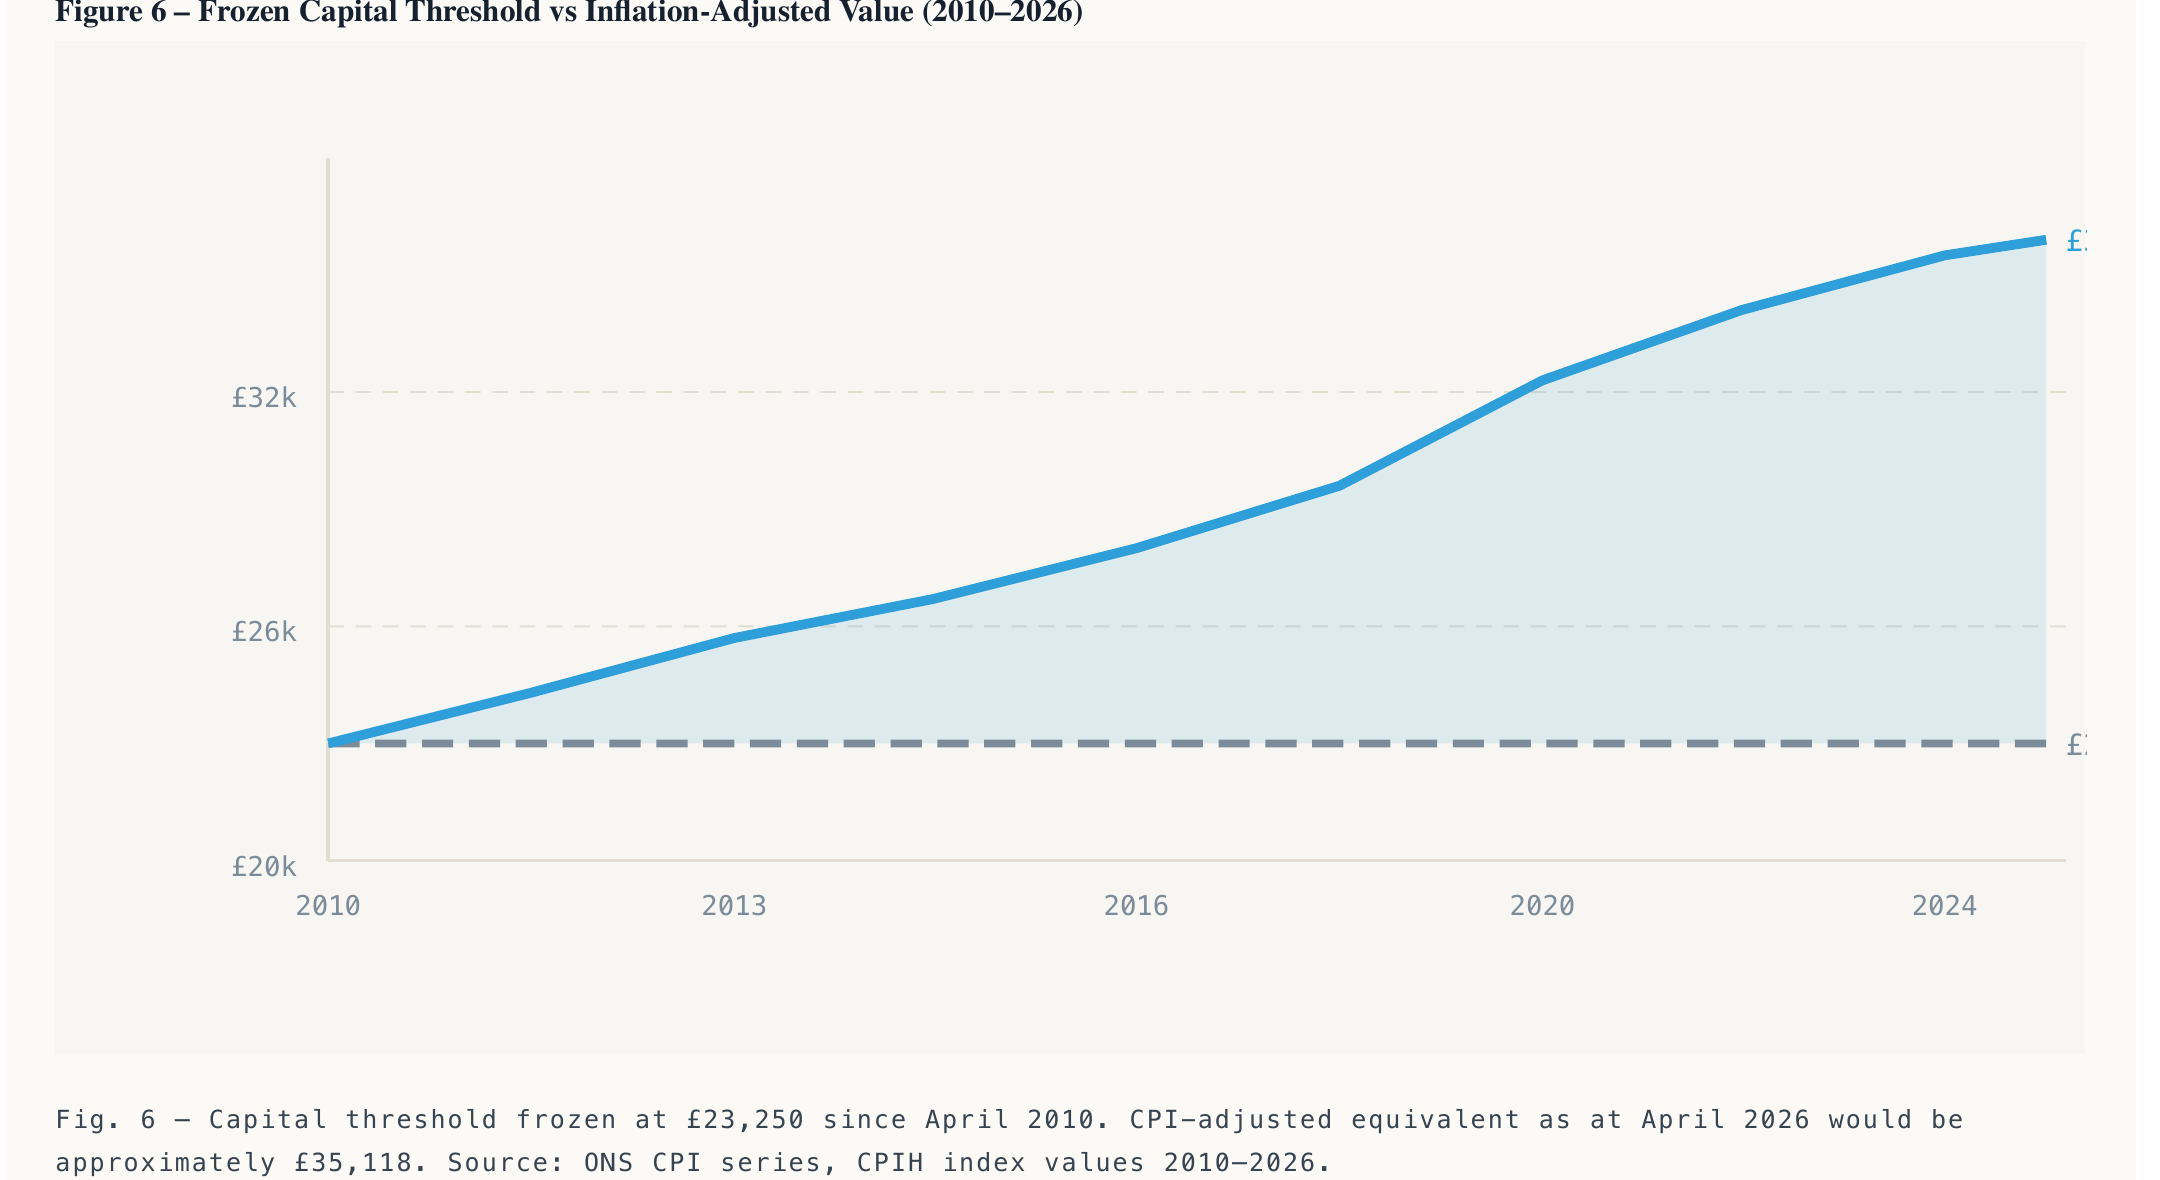
Individuals feel this through a means test that has not moved since 2010/11. The upper capital threshold, above which someone must fund their own care in full, is still £23,250; had it risen with inflation it would be roughly £35,118 today.
There is no cap on lifetime care costs, so one in seven people aged 65 and over can expect to face care costs exceeding £100,000, with no functioning insurance market to protect against it, a problem the IFS describes as structural rather than temporary. Self-funders, meanwhile, are charged on average 41 per cent more than publicly funded residents for equivalent care, a cross-subsidy worth over £1 billion a year that exists purely because local authority rates do not cover the sustainable cost of provision. And behind all of it, unpaid carers provide support the Health Foundation values at £184 billion a year, roughly the cost of a second NHS.
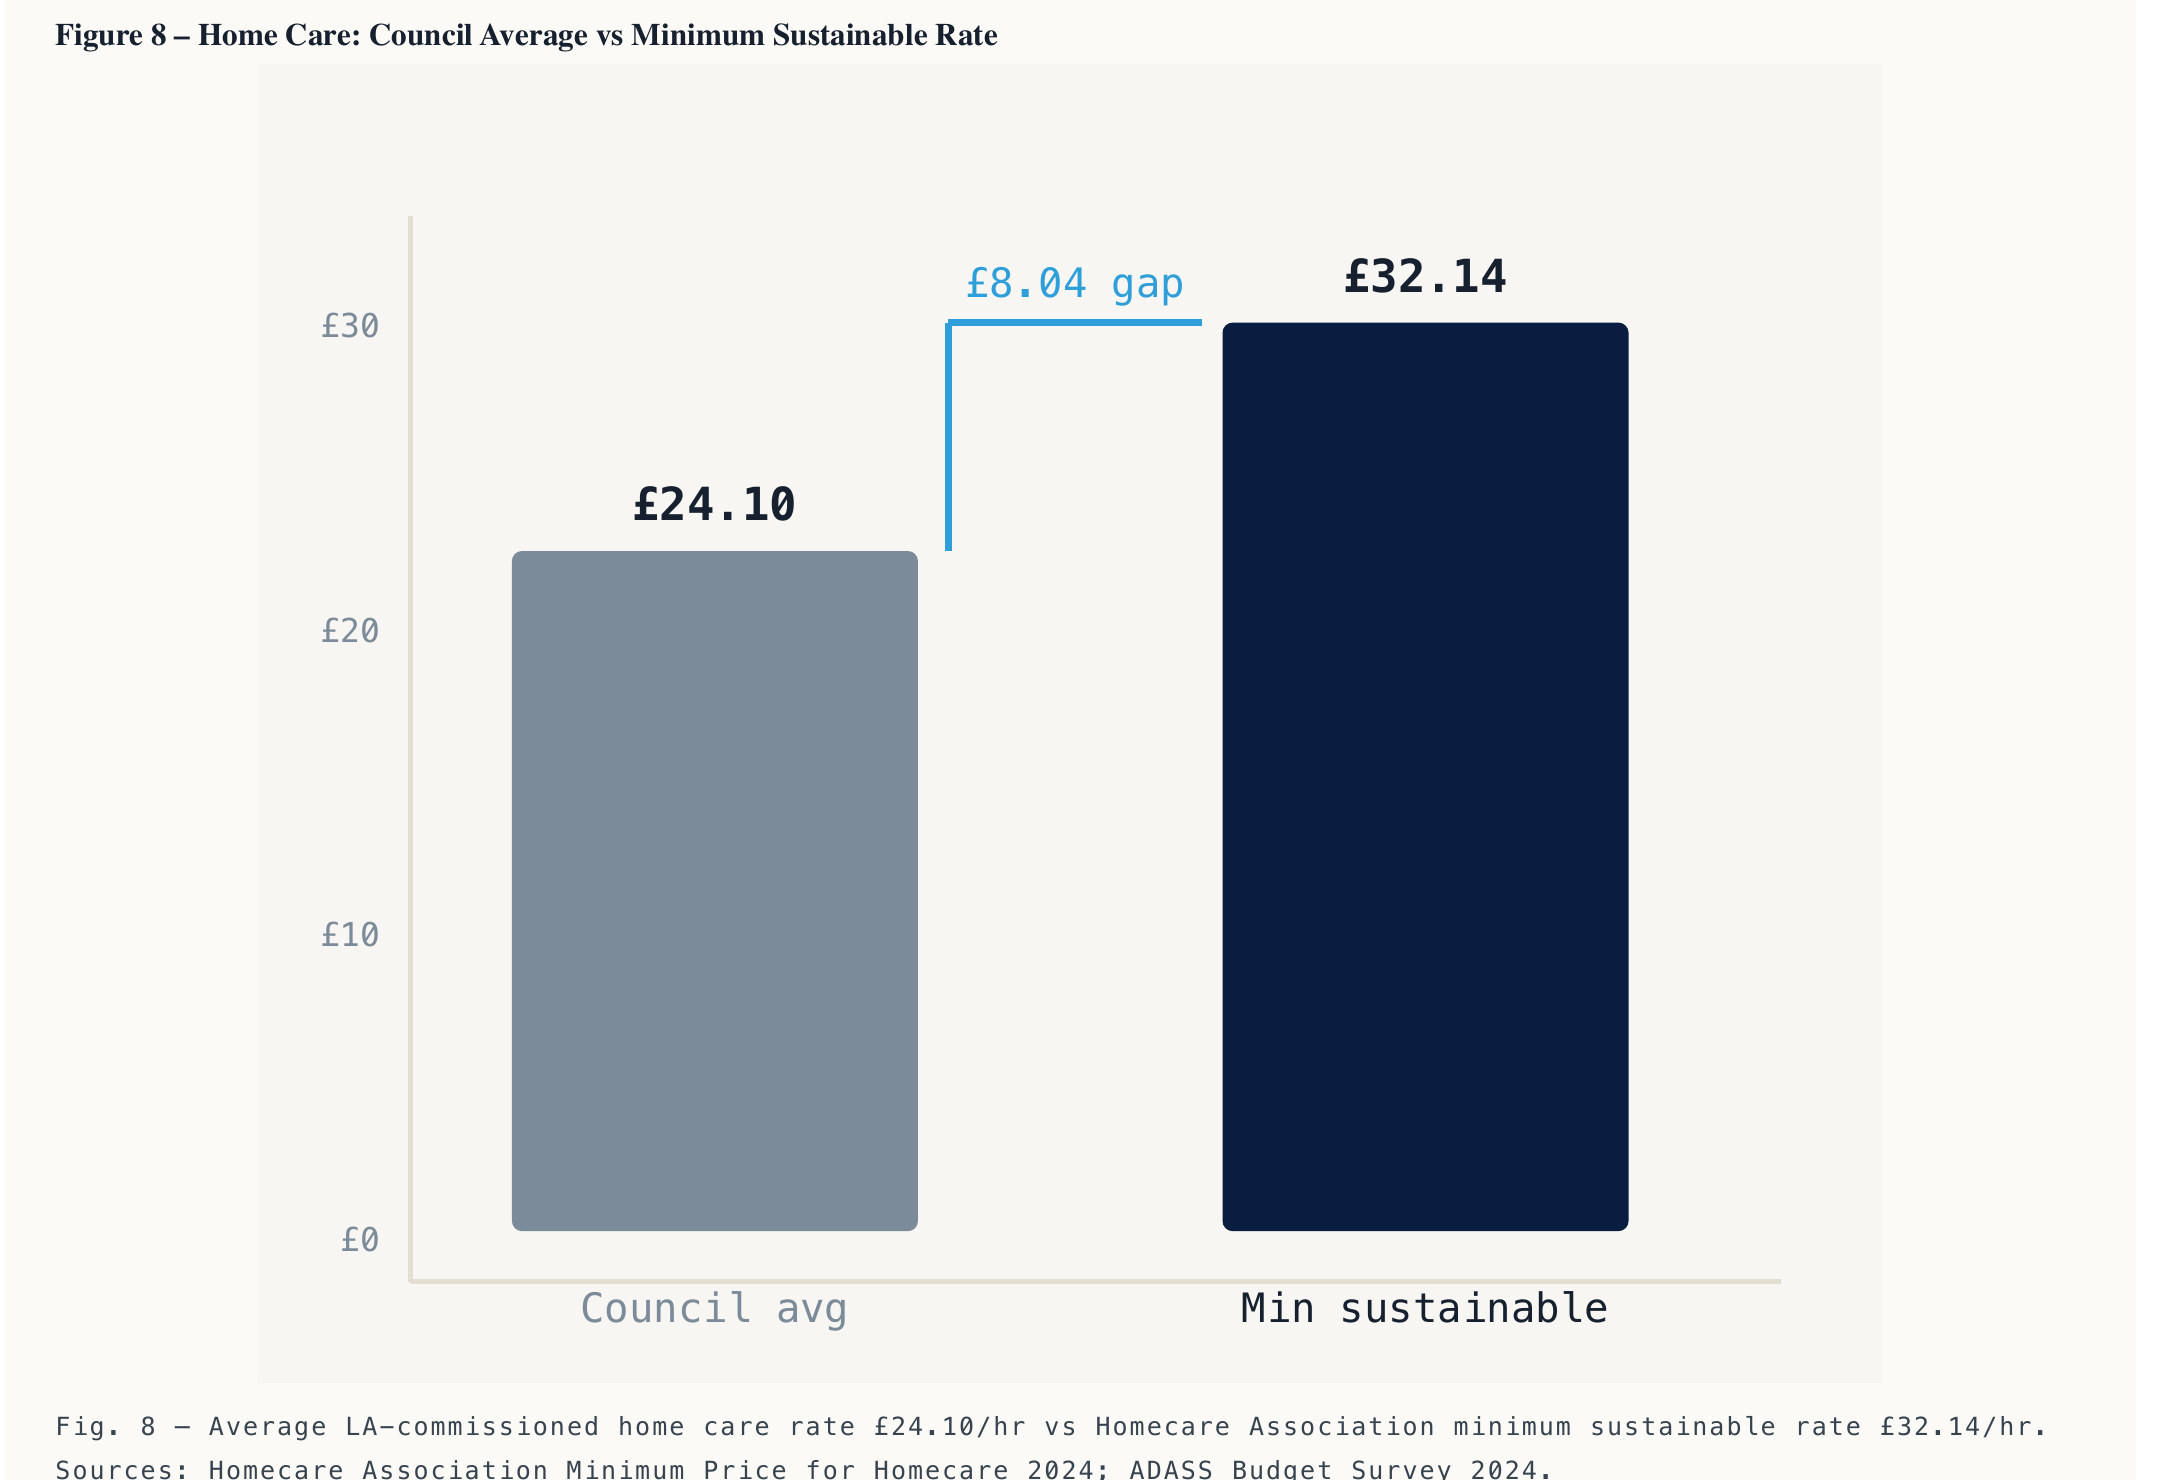
Providers absorb the rest. The average local-authority-commissioned home care rate is £24.10 an hour, against a Homecare Association minimum sustainable rate of £32.14 — a gap that only around one per cent of commissioned contracts actually close.
Residential care margins have fallen from around 33 per cent in 2008/09 to roughly 25 per cent by 2022/23. In 2019, the most recent full pre-pandemic year, care home closures exceeded openings for the eighth consecutive year, a net loss of more than 23,000 beds nationally. None of that is abstract for the NHS either: delayed hospital discharges attributable to social care factors cost an estimated £1.89 billion in acute bed occupancy in 2023/24 alone.
What we are proposing, and what it costs
The paper does not argue for a free, NHS-style care service, and it is explicit about that. It argues for a national funding settlement built on three principles: pooling financial risk nationally rather than across 153 individual budgets; a statutory entitlement to support triggered by assessed need rather than local budget discretion; and care that continues to be commissioned and delivered locally, within that national framework. Germany's non-means-tested entitlement model, Japan's nationally set fee schedule and Denmark's national-floor-with-local-flexibility approach all point the same way: systems that hold quality and access steady do it through stable national institutions, not repeated local negotiation.
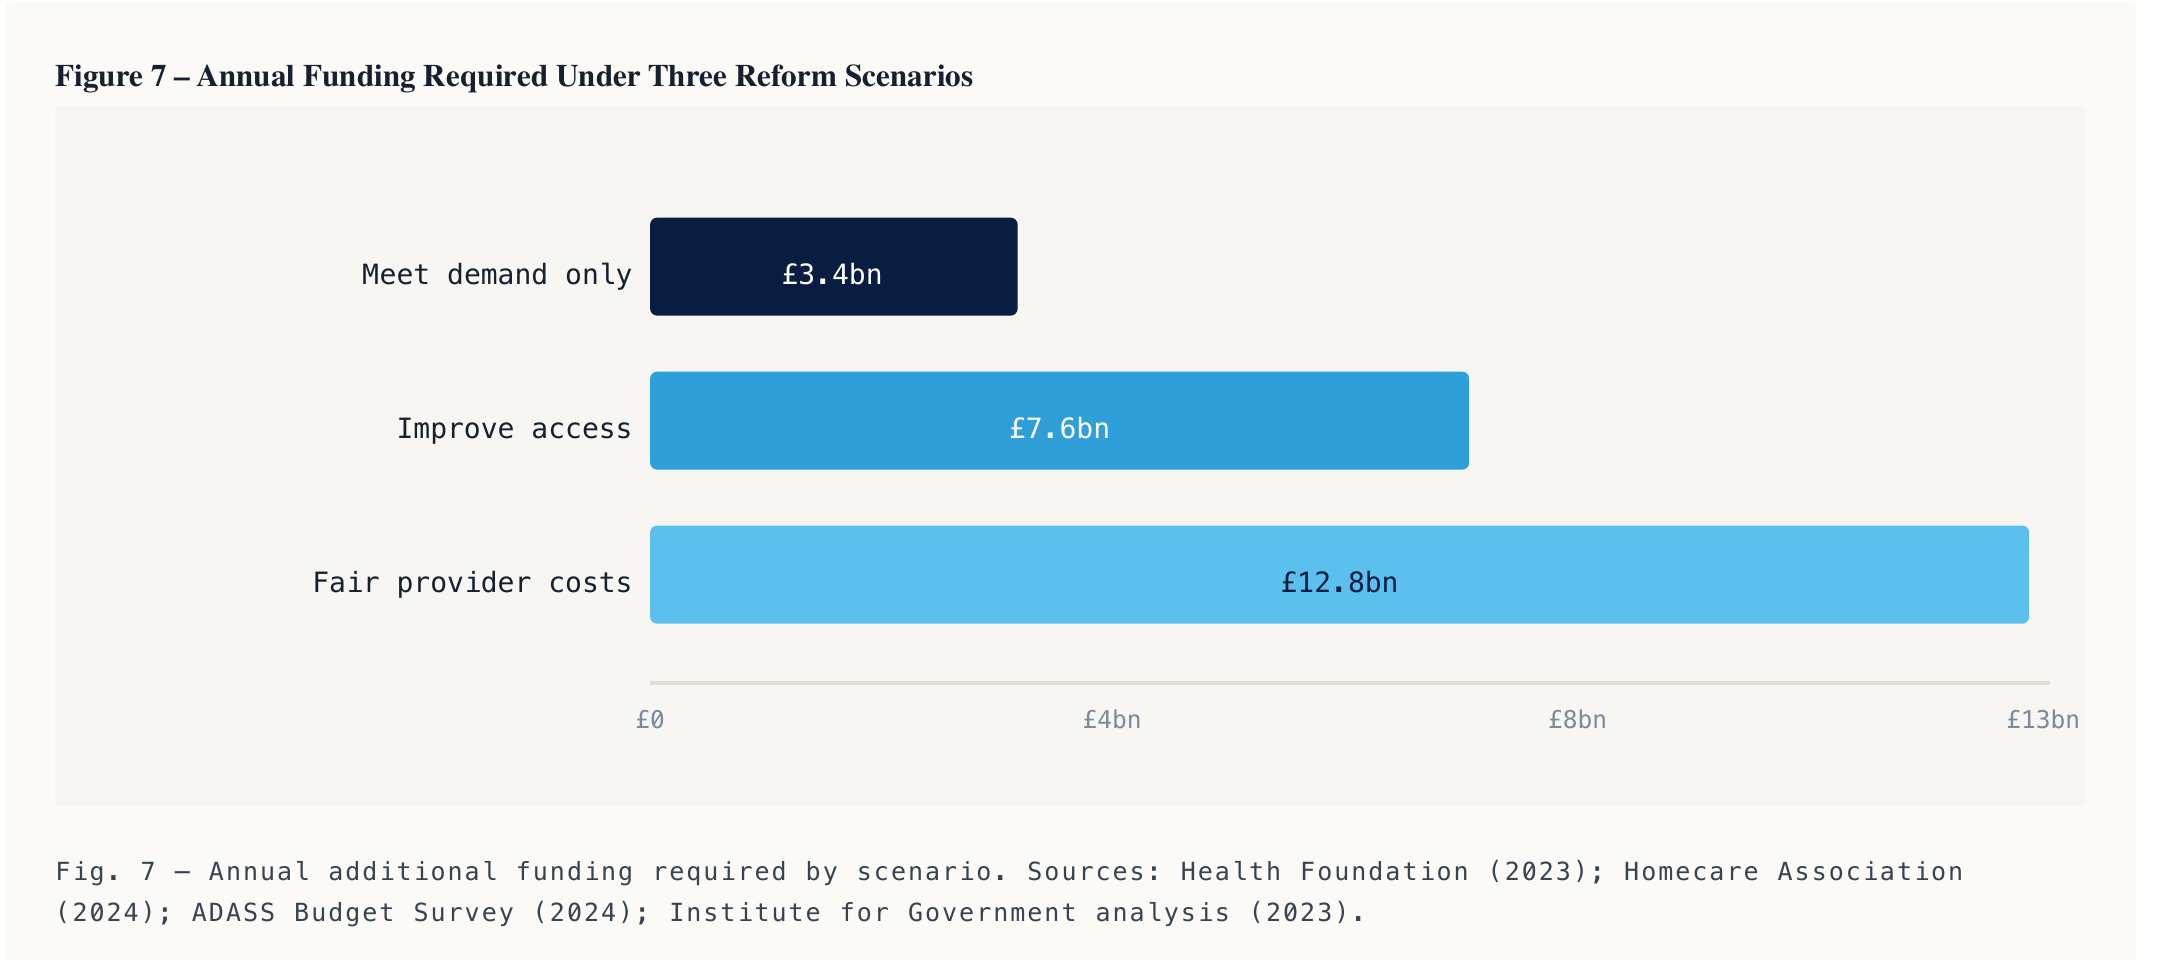
We set out ten specific recommendations building on those principles, from a ring-fenced national care grant and a national tariff for commissioned care, to a lifetime cap on personal contributions and a genuinely functioning Deferred Payment Agreement scheme, so no one is required to sell their home in their lifetime to pay for care. The Health Foundation's modelling puts a number on the ambition required.
These are large sums, but they should be weighed against the alternative, which is not saving money. It is a system that gets more expensive to repair with every year that reform is deferred, as it has been four times in the past fifteen years.
The Casey Commission has, in the Health and Social Care Select Committee's own assessment, the most complete evidence base of any social care review in a generation. This paper is the Care Association Alliance's opening contribution to that process, written by people who represent the providers actually delivering care under the system as it exists today.
Read the full interactive analysis, including the authority-by-authority data behind every figure in this piece, or download the complete paper as a PDF.
Sources and method
- Long-run public social care spending projections, Office for Budget Responsibility (2024)
- ADASS Budget Surveys 2013-2024, ADASS
- Social Care Funding Gap, Health Foundation (2023)
- Social Care 360, The King's Fund
- Adult Social Care Finance Report (ASC-FR) 2024/25, NHS Digital
- Minimum Price for Homecare 2024, Homecare Association (2024)
Related questions
What is a "national funding settlement" for social care?
It means pooling the financial risk of demographic change nationally instead of spreading it across 153 individual council budgets, giving people a statutory right to publicly funded support once they meet a nationally set eligibility threshold, and keeping the actual assessment and delivery of care local. It is not a proposal to make care free at the point of use, or to fold social care into the NHS.
Why do two councils with similar populations spend such different amounts on social care?
Our modelling found that age, deprivation, local care costs and working-age need together explain less than half the difference in spend per adult between authorities. Between 55 and 66 per cent of the gap is unexplained by any of those legitimate factors, and the pattern does not track a simple north-south or urban-rural divide.
How much would it cost to close the social care funding gap?
The Health Foundation''s modelling puts the cost of three levels of ambition at roughly £3.4 billion a year just to meet current demand, £7.6 billion to meaningfully improve access to around 1.1 million more care packages, and £12.8 billion to fund providers at the fair cost of care.
Why are care home closures outpacing openings?
Local authority fee rates, including a home care rate of £24.10 an hour against a minimum sustainable rate of £32.14, have not kept pace with the cost of delivering care. Residential care margins have fallen from around 33 per cent in 2008/09 to roughly 25 per cent by 2022/23, squeezing providers'' capacity to invest, which is one reason closures outpaced openings for the eighth year running in 2019.